How to Score Your Innovation Portfolio: Self-Assessment Framework

Managing an innovation portfolio isn’t like managing traditional investments. You can’t predict when a new product will hit or how big it’ll be when it does.
The problem gets worse when you’re juggling dozens of competing ideas. Which ones deserve funding? Which ones are quietly draining resources without moving the needle?
Most organizations struggle here. They rely on gut feelings or whoever shouts loudest in the meeting room.
Scoring your innovation portfolio changes everything. It turns subjective debates into objective decisions. It prevents “zombie projects” from consuming your budget while delivering nothing.
The Four Essential Evaluation Criteria
Every project should be scored across four dimensions. Use a 1-5 scale to reduce subjectivity.
1. Strategic Fit (The Gatekeeper)
This matters most. A profitable project that doesn’t align with your strategy is a distraction, not an opportunity.
Ask whether the project supports a top-tier strategic objective. Does it fill a gap in your current portfolio?
Here’s how to score strategic fit:
- Score 1 (Poor Fit): No documented alignment with any strategic goal. It’s a “rogue” initiative driven by individual interest).
- Score 2 (Low Fit): Tangential alignment with a strategic goal but doesn’t directly drive key results.
- Score 3 (Medium Fit): Supports a departmental goal or minor initiative. Useful but not critical.
- Score 4 (High Fit): Directly supports a C-level, board-approved initiative. Success moves the needle on corporate KPIs).
- Score 5 (Critical): Mission-critical to one of your top 3 strategic priorities for the year. Failure would materially impact core strategic outcomes.
Don’t let excitement override alignment. The best idea in the world is worthless if it doesn’t serve your strategy.
2. Market Potential (Desirability)
This assesses external demand and the size of the prize. The common mistake? Confusing internal excitement with actual market demand.
Focus on validated learning, not assumptions. Has customer research proven the pain point is real and urgent?
Score market potential like this:
- Score 1 (Low Potential): Niche market with limited growth. Heavy competition from dominant players. No clear customer urgency.
- Score 2 (Restricted): Large but saturated market. Your solution offers only incremental benefits over existing options.
- Score 3 (Moderate): Clear customer need identified. Substantial market size. Moderate growth potential.
- Score 4 (Strong): High-growth market with validated demand through pilots or pre-orders. Significant competitive advantage.
- Score 5 (Disruptive): Massive addressable market. Urgent, unmet customer need. Potential for first-mover advantage or new category creation.
Evidence beats enthusiasm every time. Demand surveys from actual prospects count while internal polls don’t.
3. Technical Feasibility
This creates a reality check on your ability to deliver. Can you actually build this thing?
Consider technology complexity, resource availability, and realistic timelines. Don’t let optimism cloud your judgment here.
The scoring breakdown:
- Score 1 (Very High Risk): Relies on unproven technology. Requires expertise you don’t have internally or through partners. High failure risk.
- Score 2 (High Risk): Technology exists but is new to your company. Significant integration challenges expected. Resource gaps exist.
- Score 3 (Moderate Risk): Standard development cycle. Solvable technical challenges with current resources. Team has gaps but can address them.
- Score 4 (Low Risk): Proven technology. Uses existing platforms and APIs. The team is fully staffed and experienced.
- Score 5 (Minimal Risk): Off-the-shelf implementation. Strong compatibility with existing infrastructure. Short deployment cycle.
Be brutally honest. Overconfidence here kills more projects than underestimating market demand does.
4. Financial Viability
While difficult for early-stage innovation, financial projections help balance your portfolio. Don’t obsess over precision that doesn’t exist yet.
Look at revenue potential, cost efficiency, and expected ROI. For transformational projects, focus less on immediate returns and more on strategic option value.
Traditional financial metrics work great for core innovations. They’re misleading for transformational bets that won’t show returns for years.
How to Apply Weighted Scoring
Not all criteria matter equally. A weighted scoring model adjusts raw scores based on what matters most to your organization.
A startup might weight “Time to Market” at 40% because speed is their only advantage. A pharmaceutical company might weight “Regulatory Compliance” and “Scientific Merit” higher.
The formula is simple:
Total Score = (Criterion 1 Score × Weight 1) + (Criterion 2 Score × Weight 2) + … and so on. Make sure your weights add up to 100%.
Practical example: Let’s score an “AI Customer Service Agent” project.
| Criterion | Weight | Raw Score | Weighted Score |
|---|---|---|---|
| Strategic Fit | 30% | 5 (Aligns with digital transformation) | 1.5 |
| Market Potential | 30% | 4 (Strong demand validated) | 1.2 |
| Technical Feasibility | 20% | 2 (Requires new NLP capabilities) | 0.4 |
| Financial Viability (ROI Potential) | 20% | 4 (High cost savings potential) | 0.8 |
| Total | 100% | – | 3.9 / 5.0 |
This quantitative output gives you a rational basis for Go/No-Go decisions. It moves you beyond subjective debate and into data-driven territory.
Create a ranked list of all projects. Allocate resources from the top down until your budget runs out. Projects scoring below a certain threshold (say, 2.5) get killed or sent back for refinement.
Account for Risk and Uncertainty
A simple weighted score doesn’t capture the full picture of risk. Two projects with identical scores can have vastly different risk profiles.
Beyond Simple Scores: Risk-Adjusted Valuation
A project with a potential $100M return and 10% success probability is fundamentally different from one with a $10M return and 90% success probability.
Their weighted scores might look similar, but they’re not the same bet.
A risk-adjusted value heuristic inspired by the Sharpe Ratio adapts financial market thinking to innovation portfolios. It compares expected value relative to delivery risk.
The simplified approach:
Divide your projected value score by your risk proxy (such as feasibility). This is a practical heuristic, not a standardized financial metric.
You don’t need complex math here. Use your feasibility scores as risk proxies, where lower feasibility scores indicate higher delivery risk.
A project scoring 5 on feasibility and 4 on value beats one scoring 2 on feasibility and 5 on value.
Visualize Your Portfolio Health
Numbers in a spreadsheet don’t show you the “shape” of your portfolio. Visual maps reveal health issues instantly.
Create a bubble chart with these elements:
- X-Axis: Technical Novelty (Low to High)
- Y-Axis: Market Novelty (Low to High)
- Bubble Size: Investment Capital or Projected NPV
- Color: Strategic Horizon (Core/Adjacent/Transformational)

Three warning signs jump out immediately:
The “Safe Bet Trap” shows all bubbles clustered in the bottom-left corner. You’re only doing core, incremental work. You’re under-investing in your future and risking obsolescence.
The “Gambler’s Portfolio” displays only massive, high-risk bubbles in the top right. You lack stable cash-flow generators to fund your experiments. One bad year could kill everything.
The “Shotgun Approach” scatters tiny bubbles everywhere without focus. You’re under-resourcing critical bets and spreading yourself too thin to win anywhere.
A healthy portfolio shows a deliberate distribution aligned with your strategic buckets. Most bubbles sit in core territory with a few meaningful bets in transformational space.
The Five Most Dangerous Biases
Even the best framework fails if the people using it can’t see their own blind spots. Cognitive biases skew decisions more than bad data does.
1. Sunk Cost Fallacy
You keep funding a failing project because of money already spent. “We’ve already invested $2 million. We can’t stop now.”
Mitigation: Use kill criteria at stage gates.
Frame the decision as “purchasing an option to invest elsewhere,” not “losing the investment.” Separate decision-makers from project champions.
2. Confirmation Bias
You cherry-pick data that supports your hypothesis while ignoring contradictory signals. Survey results get filtered to show only positive customer interest.
Mitigation: Implement Red Teaming.
Assign a group specifically to find flaws in the project’s assumptions. Require teams to present disconfirming evidence at stage-gate reviews.
3. HiPPO Effect (Highest Paid Person’s Opinion)
You score a project high because a senior executive sponsors it. The CEO likes the idea, so it gets a 5.
Mitigation: Use anonymized scoring sessions. Conduct individual scoring before group discussion to prevent anchoring on the leader’s opinion.
4. Overconfidence Bias
You systematically underestimate time and cost required for development. “We can build this in 3 months.” Reality: 12 months.
Mitigation: Apply reference class forecasting.
Adjust estimates based on actual historical performance of similar past projects rather than optimistic team predictions.
5. Bandwagon Effect
You launch projects because everyone else is. “Everyone’s doing blockchain/AI, so we must too.”
Mitigation: Evaluate projects against specific strategic fit criteria, not industry trends. Ask “Why us?” and “Why now?” before jumping on the bandwagon.
Build diverse scoring committees. Homogeneous teams suffer from groupthink and shared blind spots. Include technical, commercial, operational, and customer-facing perspectives.
How to Conduct Your Self-Assessment
Before you can score your portfolio effectively, you need to understand your organization’s current state. As you know, capability matters as much as the portfolio itself.
Assess Your Portfolio Management System (Process Health)
Score each statement on a scale of 1 (Strongly Disagree) to 5 (Strongly Agree):
- Strategic Clarity: We have clearly defined Strategic Buckets with specific budget allocations for each horizon.
- Governance Rigor: We have a standardized stage-gate process where projects are regularly killed or pivoted based on data.
- Metric Suitability: We use different metrics for different innovation types (learning metrics for disruptive, financial metrics for incremental).
- Resource Visibility: We have a real-time view of resource allocation across all active projects and can identify bottlenecks immediately.
- Decision Hygiene: Our investment decisions are protected from cognitive biases through structured scoring and diverse committees.
Add up your scores. Here’s how to interpret your results:
| Score Range | Maturity Level | What It Means | Your Priority |
|---|---|---|---|
| 5–15 | Ad Hoc | Innovation is random and reactive | Define a strategy and basic process |
| 16–20 | Defined | Process exists but may be rigid or inconsistent | Improve flexibility and metrics |
| 21–25 | Optimized | World-class capability | Continuous improvement and advanced integration |
Don’t sugarcoat your scores. Honest assessment reveals where you actually need work.
Assess Your Portfolio Composition (Asset Health)
Answer these five questions about your portfolio contents:
Alignment: What percentage of active projects directly link to a top 3 strategic goal?
Many organizations aim for a high proportion, often 70–90%+, of active projects aligned to top strategic priorities. Falling well below this range may indicate diluted focus or unfunded distractions.
Balance: Does your resource allocation match your target ratio?
If you’re aiming for 70-20-10 but actually running 95-4-1, you have a problem.
Value Distribution: Is your projected NPV too concentrated in a few moonshots?
Overconcentration creates portfolio fragility. One failure shouldn’t devastate your entire innovation pipeline.
Time-Horizon Spread: Do you have a mix of projects launching in 6 months, 18 months, and 3+ years?
You need continuous growth, not feast-or-famine revenue.
Risk Profile: Is your weighted average portfolio risk acceptable?
Calculate it through aggregating individual project risk scores. Too conservative and you’re leaving money on the table. Too aggressive and you’re gambling the company.
Run these assessments quarterly. Your portfolio health changes as projects progress through stages.
Put Your Scores to Work: Governance That Drives Action
Scores are worthless if they don’t drive action. The final piece is governance: the decision-making process that uses scores to allocate resources.
Implement Metered Funding
Don’t give projects full budgets upfront. Operate like an internal venture capital firm using staged funding.
Projects receive small tranches of capital to reach the next milestone. At each gate, they either earn more funding or get killed.
Gate 1 (Idea to Discovery): $5,000-$20,000 seed funding. Scoring focuses on strategic fit. Can they validate the problem is real?
Gate 2 (Discovery to Validation): $50,000-$200,000 Series A funding. Scoring focuses on market potential and customer validation. Do people actually want this?
Gate 3 (Validation to Scaling): $500,000+ Series B funding. Scoring focuses on technical feasibility, unit economics, and ROI. Can we build and sell it profitably?
At each gate, teams must demonstrate progress on uncertainty reduction. They’re buying the right to take the next risk, not the next reward.
Monitor the Kill Rate
If 100% of projects pass Gate 1, your filter is broken. You’re not being selective enough.
A healthy innovation funnel sees roughly 50% attrition at early gates. This isn’t failure: it’s smart capital allocation.
Early‑stage attrition is normal in healthy innovation funnels.
Many organizations expect significant drop‑off at early gates, although the exact rate varies based on idea volume, gate rigor, and portfolio strategy.
You’re concentrating resources on winners as they de-risk. The projects that survive early gates deserve bigger bets because they’ve proven something valuable.
Killing projects isn’t punishment. It’s responsible stewardship of scarce innovation resources. The courage to stop bad projects early funds the good ones properly.
Turn Your Scores Into Strategic Action
Your scoring framework is worthless without consistent execution. Manual tracking in spreadsheets breaks down when you’re managing dozens of projects across multiple horizons.
Accept Mission brings your scoring framework to life with custom criteria, weighted evaluation, stage-gates, and real-time tracking.
Here’s how Accept Mission supports your scoring framework:
- Custom scoring criteria that match your weighted framework exactly (strategic fit, market potential, feasibility, financial viability)
- AI-powered scoring that identifies high-opportunity projects and surfaces patterns you’d miss manually
- Automated stage-gate funnels that enforce your metered funding approach and kill criteria at each gate
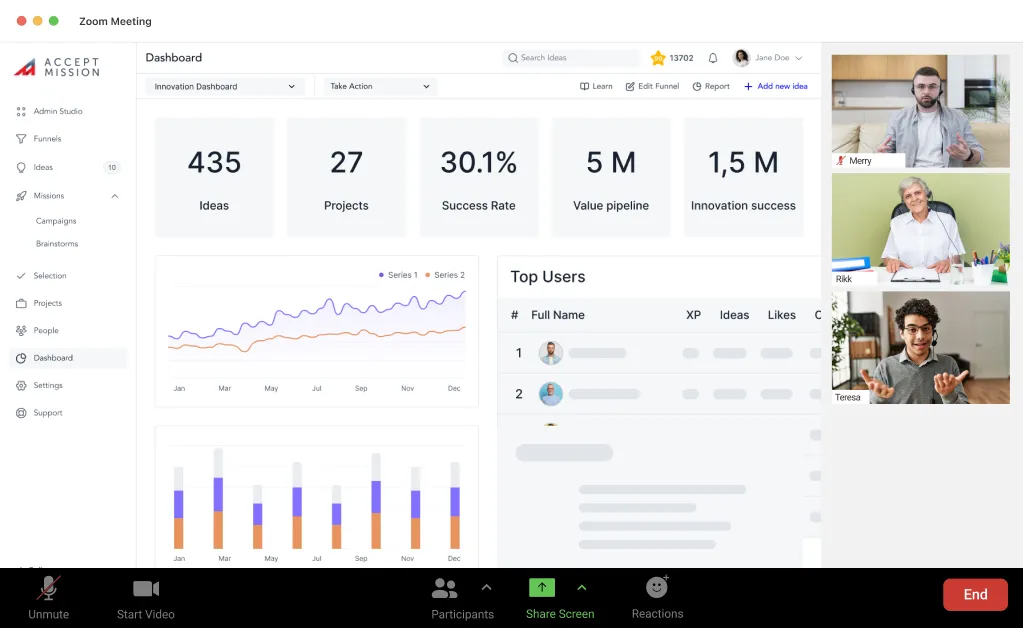
- Portfolio dashboards that visualize your innovation horizons, strategic alignment, and risk distribution in real-time
- Group decision-making tools that protect against cognitive biases through structured, anonymized scoring sessions
- Strategic alignment tracking that shows which projects link to your top 3 goals and flags distractions automatically
The platform handles the administrative burden so your team can focus on strategic judgment.
Your scores automatically update as projects progress through gates, giving you current portfolio health metrics without manual data entry.
Book a demo with Accept Mission today and see how Accept Mission reports client‑achieved outcomes, including up to 32% cost reduction and 21% faster implementation.