The Go/No-Go Scoring Model: Prioritizing Innovation Projects Without Gut Feel

Every executive has sat through that meeting.
Ten project proposals, budget for three, and no clear way to choose among passionate pitches, speculative revenue, and a problem-solving solution that lacks strategic impact.
Most leadership teams default to gut instinct or defer to the highest-ranking voice in the room.
The result is a portfolio that feels random: half your innovation budget collapses under execution while safe bets generate incremental returns as competitors make bold moves.
A weighted scoring model transforms subjective debates into objective decisions.
It gives judgment a structured framework to operate within, turning opinion-based prioritization into principle-based strategy.
When “Gut Feel” Becomes Your Biggest Innovation Bottleneck
Here’s an uncomfortable truth about innovation management:
Most organizations claim they’re data-driven, but executives still pick projects based on intuition.
A 2020 study found that 78% of companies say they want to be more data-driven. Yet two out of three data leaders watch their executives ignore the numbers when making big decisions.
The same study revealed that 56% of C-level executives doubt the data they receive. This cycle means poor data validates intuition, preventing the necessary fixes to produce trustworthy data.
Three Cognitive Traps That Derail Project Selection
Intuition feels powerful, but it’s unreliable when you’re making strategic decisions.
Here are the three biggest traps that catch even experienced leaders:
- Confirmation bias: Leaders unconsciously seek validating information, fixating on positive meetings and dismissing red flags.
- Limited perspective: Intuition, shaped by personal experience, fails with novel market conditions or disruptive technologies.
- No early warning system: Gut-feel decisions lack objective metrics, allowing project failure to go unnoticed for months.
The goal isn’t to eliminate intuition entirely. Experienced professionals have developed what researchers call an “elaborate intuiting process.”
It’s a form of expertise-based thinking that helps them navigate uncertainty.
The real goal is to become an “informed intuitant.” This means blending analytical skill with intuitive judgment. You use data to refine your instincts, not replace them.
Why a Weighted Scoring Model Changes Everything
A weighted scoring model gives you a structured way to evaluate innovation projects. It doesn’t tell you what to think, but it does tell you how to think about prioritization.
What a Scoring Model Actually Does
Think of it as a translation tool. You have diverse projects that are hard to compare directly.
One project promises high financial returns. Another offers strategic positioning against competitors. A third reduces technical risk across your platform.
How do you compare these? They’re apples, oranges, and bananas.
A scoring model lets you blend qualitative factors like “Strategic Fit” with quantitative ones like “Potential ROI” into a single, comparable number.
That number gives you a clear, objective basis for ranking projects. It helps you make informed go/no-go decisions without relying purely on who presents most persuasively.
Six Tangible Benefits That Justify the Investment
Here’s what changes when you implement a scoring model:
- Strategic alignment: The model acts as a governor ensuring approved projects actually support your business objectives and strategic goals.
- Objective decision-making: The framework strips away emotional and political factors, neutralizing the “loudest person in the room” problem.
- Resource optimization: The model provides a rational basis for directing limited time, budget, and talent to the highest-value initiatives.
- Transparency and buy-in: Stakeholders understand why projects get approved or rejected by reviewing scores against established criteria.
- Portfolio risk control: You get a portfolio-level view of risk before committing capital and teams.
- The power to say no: An objective model gives you data-backed rationale for rejecting pet projects and poor strategic fits.
Here’s how the shift looks in practice:
| “Gut Feel” Decision-Making | Data-Informed Framework |
|---|---|
| Driven by personal feelings and biases | Driven by objective, data-backed criteria |
| Prone to confirmation bias and limited perspective | Reduces impact of emotion and personal bias |
| No repeatable process; “who yells loudest” wins | Structured, consistent process for all projects |
| Decisions are opaque and confusing | Transparent; stakeholders see why projects were chosen |
| No early warning for bad decisions | Clear risk metrics assessed upfront |
| Resources go to “pet projects” | Resources allocated to highest-value projects |
| Portfolio disconnected from strategy | Strategic alignment guaranteed across portfolio |
The process of creating the model is often as valuable as the scores themselves.
Gathering stakeholders to debate and select criteria forces your organization to have difficult conversations.
You clarify what “strategy” and “value” actually mean in practice, not just in mission statements.
Building Your Model: The Three Core Components
Every weighted scoring model has three essential parts. Get these right, and the rest flows naturally.
Component 1: Choosing Criteria That Actually Matter
Your criteria become your operational definition of strategy. If you don’t include “strategic fit” as a criterion, you’re saying strategic alignment doesn’t matter. Choose carefully.
Most effective innovation models are built from five common pillars. You can customize these for your specific situation.
Strategic Alignment answers “Does this meet our bigger picture?”
This links the project directly to your organization’s mission, vision, and current objectives. Many experts consider this the most important criterion.
Value Generation answers “What will this accomplish?”
This pillar is broad and can include several sub-criteria:
- Market attractiveness measures the size and growth potential of your target market.
- Revenue potential estimates the project’s contribution to top-line growth.
- Customer impact captures how deeply you’re solving a real pain point.
- Competitive advantage assesses whether you’re creating a defensible position.
Feasibility answers “Can we actually do this?”
This is your reality check on capabilities and resources:
- Technical feasibility: Do you have the technology and skills to build this, or can you acquire them?
- Resource availability: Do you have the people, budget, and time to execute?
- Implementation complexity: What’s the level of effort, dependencies, and challenges required?
Risk answers “Is this worth the possible downside?”
This category scores the level of risk the project introduces. You can use a simple risk-versus-reward score or break it down into technical risk, financial risk, and market risk.
Urgency and Timing answers “Is now the right time?”
This captures time-sensitive factors. Regulatory deadlines matter. So does a narrow window for first-mover advantage.
Here’s a practical menu of criteria you might use:
| Category | Criterion | Sample Scoring Question |
|---|---|---|
| Strategic | Strategic Alignment | Does this support one of our 3 key strategic pillars for this year? |
| Value | Revenue Potential | What’s the projected 3-year revenue impact? |
| Value | Customer Impact | How many customers will this affect, and how deeply? |
| Value | Competitive Advantage | Will this give us a unique advantage for 18+ months? |
| Feasibility | Technical Feasibility | How confident are we (0-100%) that we can build and scale this? |
| Feasibility | Resource Effort | What’s the total estimated effort in time and cost? |
| Risk | Risk Level | What’s the likelihood and potential impact of failure? |
| Timing | Urgency | Is this critical now, or can it wait 6-12 months? |
An alternative framework from Strategyzer focuses on evidence instead of predictions.
It scores four areas:
- Desirability: Do customers want this?
- Feasibility: Can we build it?
- Viability: Can we make money?
- Adaptability: Can we compete?
This works especially well for early-stage innovation where hard data is scarce.
The key insight is this:
A company focused on disruption should weight “Market Attractiveness” heavily. A conservative organization might prioritize “Technical Feasibility” and “Risk.”
Your model reflects your actual priorities, not what’s in your PowerPoint deck.
Component 2: Weighting as Strategic Debate
After selecting criteria, you assign weights.
Weighting is straightforward mechanically: each criterion gets a percentage weight, and the sum must equal 100%.
A simple model might look like:
- Strategic Alignment (40%)
- Revenue Potential (30%)
- Technical Feasibility (20%)
- Risk (10%)
This exercise is profoundly strategic and must be conducted with senior decision-makers and key stakeholders.
When you get alignment on weights before scoring any projects, you prevent subjective prioritization later.
The final ranked list becomes defensible because everyone agreed on the rules beforehand.
Component 3: Creating Anchored Scoring Scales
The final component is your scale for scoring each criterion. Most models use a 1-5 or 1-10 numerical scale.
But here’s the catch: A number alone is subjective. Without clear definitions, a “5” means different things to different people.
The key is creating “anchors.”
These are clear, unambiguous definitions for what each number represents. This is the most time-consuming part of setup, but also the most critical.
A “5” for “strategic fit” is just an opinion. A “5” anchored to a specific definition becomes an objective evaluation.
Here’s what properly anchored scales look like:
| Score | Label | Objective Definition for “Strategic Fit” |
|---|---|---|
| 1 | Poor | Project has no documented alignment with any current strategic goal |
| 2 | Low | Project has tangential or “soft” alignment with a strategic goal |
| 3 | Medium | Project directly supports a departmental goal or minor strategic initiative |
| 4 | High | Project directly supports a C-level, board-approved strategic initiative |
| 5 | Excellent | Project is mission-critical and supports one of the company’s top 3 strategic OKRs for the fiscal year |
This anchored scale prevents two executives from scoring the same project differently based on personal interpretation.
The scorer must find evidence that maps the project to a specific definition. This dramatically improves objectivity and consistency.
Implementation: From Workshop to Decision
A scoring model isn’t just a spreadsheet. It’s a business process that requires stakeholder management and data governance.
Phase 1: Build the Foundation (Before You Score Anything)
You can’t build a trusted model in isolation. A “perfect” spreadsheet created in a PMO silo will be ignored if leadership doesn’t buy in.
Start by identifying your key stakeholders. This team must be cross-functional and have executive sponsorship:
- Senior leadership: To provide strategic goals and high-level direction
- Finance: To validate budget, cost data, and financial criteria
- Functional heads: From engineering and marketing to provide realistic feasibility input
- Project and product managers: To represent on-the-ground execution realities and customer needs
Next, establish data-driven principles. Your model can’t work on a foundation of data chaos:
- Centralize your data: Pull from a trusted, single source of truth before you analyze anything
- Implement data governance: Ensure quality, integrity, and security so decision-makers trust what they see
- Promote data literacy: Make sure everyone understands how to interpret the model’s outputs
The primary goal of this phase is securing upfront alignment.
Use your stakeholder group to collaboratively define criteria, weights, and scoring scales before evaluating any projects. This single step prevents bias and subjective prioritization later.
When leaders co-author the model, they trust its outputs.
Phase 2: Run the Prioritization Workshop
The workshop is where your model comes to life. It’s a structured, facilitated meeting to score, debate, and rank projects.
Before the meeting, the project manager has work to do.
Compile a complete list of all projects to be prioritized. Source these from sales documents, customer requests, and internal brainstorming.
Distribute pre-reading materials including current OKRs, project briefs, and most importantly, the agreed-upon scoring model itself.
Here’s a sample 60-90 minute workshop agenda:
- Revisit Goals (5 min): Restate high-level business goals and session purpose.
- Review and Clarify List (15 min): Clarify scope of items to prioritize; ensure shared understanding.
- Prioritize (15-20 min): Small groups score projects using the pre-agreed model on a shared visual space.
- Discuss and Disagree (20-30 min): Review scores, encourage healthy disagreement, and facilitate discussion on score differences to surface assumptions. Use a timer.
- Review and Make Cuts (10 min): Rank items; get alignment on what not to do (the “cut list”).
Disagreement is a feature, not a bug. The project manager’s role is ensuring leadership has provided clear guidance beforehand.
The pre-agreed criteria and weights serve as the objective tie-breaker to guide conversations away from opinion and back to strategy.
Phase 3: Turn Scores into Go/No-Go Decisions
After the workshop, you formalize data collection and calculation. The formula for final scores is straightforward.
Final Score = (Criterion A Score × Weight A) + (Criterion B Score × Weight B) + …
Here’s a simple example. Imagine a project scored on a 1-5 scale:
- User Demand (Weight: 50%) → Score: 3
- Revenue Potential (Weight: 30%) → Score: 5
- Effort (Weight: 20%) → Score: 4
- Calculation: (3 × 0.50) + (5 × 0.30) + (4 × 0.20) = 1.5 + 1.5 + 0.8 = 3.8
A simple spreadsheet works for most organizations starting out. More mature companies embed this logic directly into their project portfolio management software.
Here’s what a completed scoring table looks like:
| Project Name | Strategic Fit (40%) | Weighted Score | Revenue Impact (35%) | Weighted Score | Technical Feasibility (25%) | Weighted Score | FINAL SCORE |
|---|---|---|---|---|---|---|---|
| Project Alpha | 4 | 1.6 | 5 | 1.75 | 3 | 0.75 | 4.10 |
| Project Beta | 5 | 2.0 | 2 | 0.70 | 4 | 1.0 | 3.70 |
| Project Charlie | 2 | 0.8 | 3 | 1.05 | 2 | 0.50 | 2.35 |
But a ranked list doesn’t automatically tell you where to draw the line. You need to define clear thresholds for action.
Set decision rules that transform relative rankings into absolute, binary decisions:
- Go (Score >8.0): Projects above this threshold are pre-approved for funding and resourcing in the next cycle.
- Review (Score 6.0-7.9): Projects in this “bubble” category get escalated to the steering committee for further discussion.
- No-Go (Score <6.0): Projects below this threshold are automatically rejected or sent back for significant refinement.
This approach provides clarity, reduces ambiguity, and gives the process the speed and trust it needs.
Phase 4: Make It a Living System
Your model isn’t static. It’s a dynamic tool that must be revisited and refined.
The steering committee must analyze the final ranked list. This is the beginning of a strategic conversation, not the end.
Discuss real-world implications, trade-offs, and project dependencies the model might not capture.
Establish a regular review cadence to keep your model relevant:
- Revisit priorities quarterly: Account for changes in business objectives, market conditions, or resource availability
- Reassess the model annually: Ensure criteria and weights still reflect your current strategic goals
Create a feedback loop to track implemented projects against their original scores. This answers the most important question: “Does our model accurately predict success?”
If high-scoring projects consistently fail, your model is flawed. If low-scoring “skunkworks” projects succeed, analyze what success factor you missed.
This feedback loop transforms your model from a simple selection tool into a powerful learning system. Your organization gets smarter over time, refining criteria based on real-world data.
When NOT to Use This Model (And What to Use Instead)
Every tool has limitations. A scoring model is powerful, but it’s not the right answer for every situation.
The Radical Innovation Problem
Traditional scoring models have a systematic bias. They punish uncertainty and favor safe, incremental projects.
This is a feature, not a bug.
The model is designed to optimize a portfolio of sustaining innovations. But this creates what researchers call “the easiest path to mediocrity in innovation.”
Radical ideas are saturated with uncertainty. When evaluated by a standard scoring model, that uncertainty gets punished:
- Low feasibility scores: You’ve never done this before, so technical feasibility looks weak
- Low market attractiveness scores: A market doesn’t exist yet, so projections seem speculative
- Low confidence scores: You can’t be confident about something completely novel
History proves this bias plays out again and again. Katalin Karikó’s mRNA vaccine technology was dismissed as “too far-fetched” for years.
Field experiments on grant proposals confirm the pattern: novel research consistently receives lower scores than conventional research.
The solution isn’t to abandon your model. It’s to recognize its bias and plan accordingly.
Create a separate “sandbox” portfolio for disruptive ideas. Exempt these projects from your standard scoring model.
Evaluate them instead on the quality of evidence gathered, using frameworks like Strategyzer’s approach. Ask “What have you learned?” instead of “What’s the projected ROI?”
Avoiding Analysis Paralysis
The second danger is over-engineering your model. A complex, multi-criteria framework can create “analysis paralysis.”
This happens when an influx of information and options leads to overthinking and deadlock:
- Delayed decision-making: Teams get stuck in evaluation mode, endlessly debating criteria weights or demanding more data
- Over-engineering: The model itself becomes the project as teams add unnecessary complexity in pursuit of perfection
- Stifled innovation: The bureaucratic overhead discourages people from proposing new ideas at all
The solution is simplicity. Keep your initial model as simple as possible. Start with 3-5 criteria maximum. Add complexity only when you’ve outgrown the simple version.
Remember, the goal is a “good enough” framework that facilitates decisions. You don’t need a perfect academic model that produces infallible numbers.
Quick Framework Comparison
Your scoring model isn’t the only prioritization tool available. Here’s how it compares to other popular frameworks:
| Framework | Best For | Key Strengths | Main Limitations |
|---|---|---|---|
| Weighted Scoring | Strategic alignment across diverse portfolios | Infinitely flexible; customizable to your strategy; highly transparent | Can be complex to set up; requires stakeholder buy-in |
| RICE Model | Speed and simplicity for feature prioritization | Fast and objective; built-in confidence check on estimates | One-size-fits-all; no explicit strategic alignment criterion |
| Kano Model | Customer-centric feature discovery | Reveals non-obvious opportunities; identifies must-have features | Doesn’t prioritize; only categorizes by customer impact |
The RICE model is a simplified scoring framework. It evaluates projects on four fixed factors:
- Reach (how many people impacted)
- Impact (how much it affects each person)
- Confidence (how sure you are)
- Effort (how much work required)
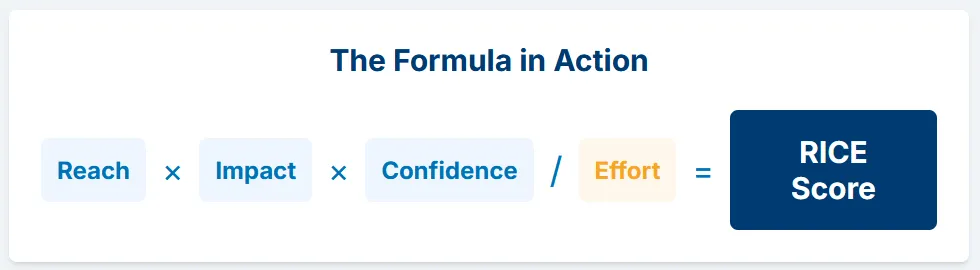
The formula is (Reach × Impact × Confidence) / Effort.
RICE works great for product teams that need speed. But it lacks flexibility.
You can’t add criteria like “strategic alignment” or “regulatory compliance.” A project could have a high RICE score but be strategically irrelevant.
The Kano model is different. It’s not a competitor to scoring models. It’s a complement.
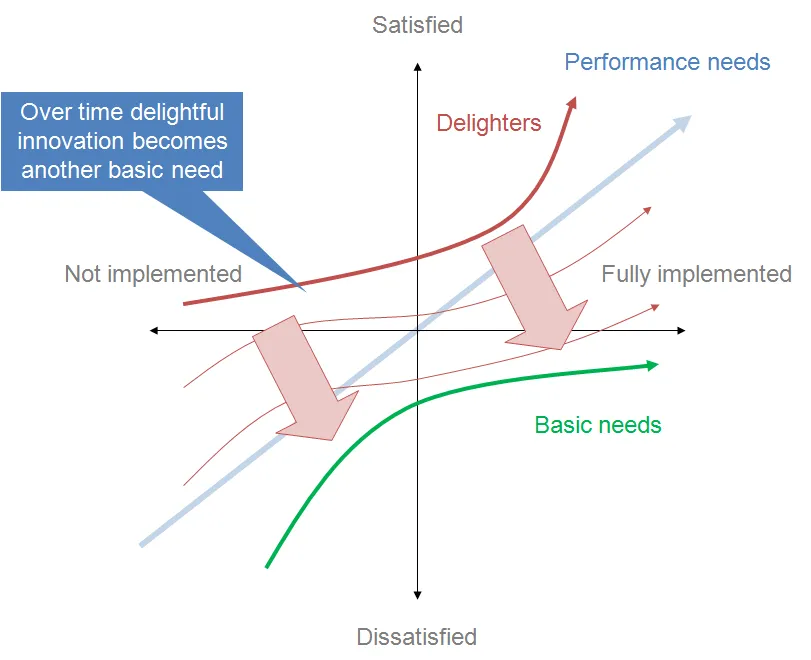
Kano categorizes potential features by their emotional impact on customers:
- Must-bes are basic, expected features.
- Performance features scale linearly with satisfaction.
- Delighters are unexpected features that create loyalty.
Use these frameworks in sequence.
Start with Kano to discover what to build based on customer needs. Then use weighted scoring to prioritize that list based on strategic alignment, cost, and feasibility.
The choice depends on your organization’s maturity and needs. A startup might thrive with RICE’s simplicity.
A mature enterprise needs weighted scoring’s flexibility. And a team disconnected from customers should start with Kano to ensure they’re building the right things.
From Theory to Practice: Making It Work
You don’t need the perfect model to start.
Begin with 3-4 criteria this quarter, maybe strategic alignment, revenue potential, and technical feasibility, run one workshop, and score 5-10 projects.
The model will feel awkward at first, and stakeholders will push back.
This is normal as it’s the model working as designed, revealing uncomfortable truths about projects leadership already committed to.
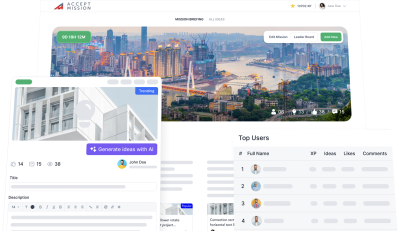
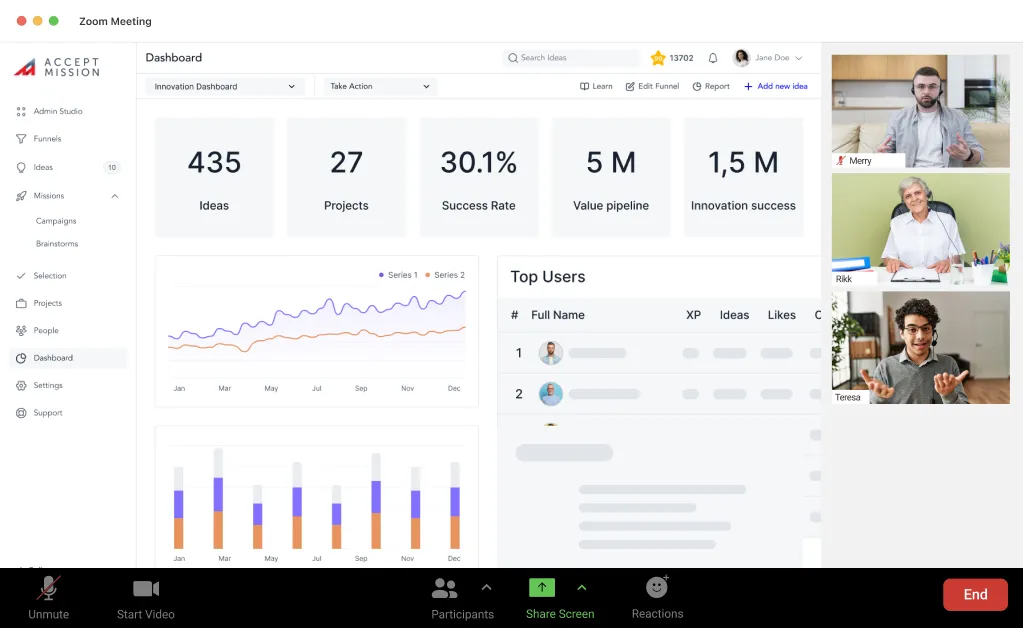
Accept Mission takes the manual work out of building and running your scoring model.
The platform centralizes your entire innovation process, from idea collection through scoring to project execution, so you’re not juggling spreadsheets, email threads, and disconnected tools.
Here’s how Accept Mission supports weighted scoring in practice:
- Custom scorecards: Configure your own scoring criteria and weights that align with your strategic priorities
- AI-powered insights: Get data-driven recommendations to prioritize the most valuable innovations and identify patterns you might miss
- Group decision-making: Enable expert juries and stakeholder teams to score ideas collaboratively with transparent voting
- Real-time dashboards: Track ROI, risk, and strategic fit with visual KPIs that update automatically as projects progress
- Workflow automation: Move ideas through your funnel automatically based on scores, triggering notifications and actions at each stage
Organizations using Accept Mission report a 32% cost reduction through stopping work on low-impact ideas earlier.
They also see 58% higher engagement across teams because the scoring process becomes transparent and defensible, not political.
The platform doesn’t replace your strategic thinking. It amplifies it by giving you the structure, visibility, and collaboration tools to turn principles into practice across your entire organization.
Ready to move from gut feel to go/no-go decisions backed by data?
Book a demo with Accept Mission to see how custom scorecards, AI-powered prioritization, and real-time dashboards can transform your innovation portfolio.